
Learning Path
Where to Begin
We are Going to start education series for those people who are studying Gann and Planets and looking forward to their observations about:-
One exclusive example of price and Time square with Planet degree:-
As many of us are crazy about Price Time square method as the name of this concept makes people crazy in my trading career i get so many queries from people about this concept as they are ready to pay huge amt to get a glimpse and people are always confused after reading of Gann books where Gann Sir only complete this concept in one line in his commodity master course “where price and time are equal in time is called price time square” by this narration its difficult to understand what is he trying to indicate after years research we find out the meaning of this he is talking about the length of time and price where they met equally is called price time square we are giving one example with more advance featured which Gann Sir talked included in his study that is the inclusion of Planet degree along with,
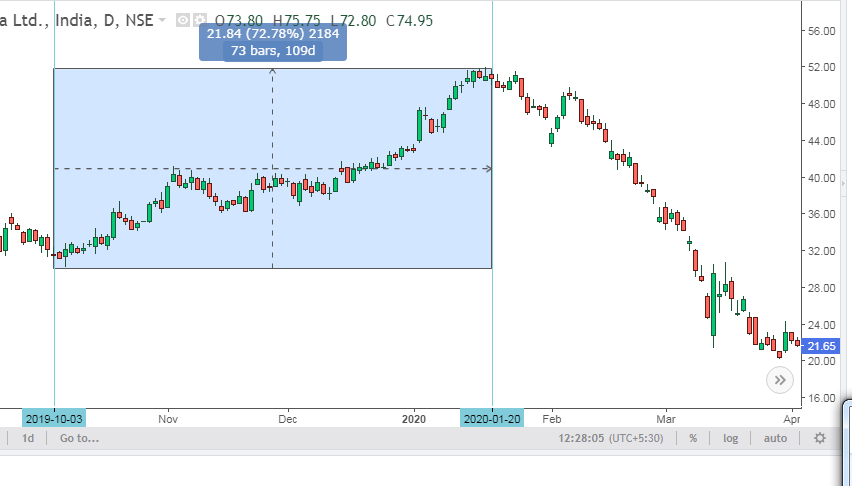
Here is one example of Sail Script low made on 3rd Oct 2019 and high made on 20th Jan 2020 difference in between is 72 bars and mars on the same date ie 03rd Oct was @179 degree GEO and 20th Jan 2020 was @251 GEO Degree Difference was exactly 72 degree
365 days is an important cycle of one year
In a circle, there are 360 degrees which very nearly correspond to this cycle. In other words, one day is equal to one degree of the circle that the Earth makes around the sun.
Hence the significance of the important divisions of the circle (into angles) on the chart. These angles are 45, 90, 120, 135, 180, 225, 240, 270, 315, and 360.
Dividing a line parallel to the 90-degree division of the circle we get a square. Divisions of this square give important angles on the charts.
There are two kinds of cycles: Time cycle or natural cycles and cycles derived from the significant prices And these cycles will have important divisions on 1/8, 1/4, 1/3, 3/8, 1/2, 5/8, 2/3, 3/4 and 7/8.
Thus the 30-year time cycle will be divided into important probable turning points as follows:
1/8 – 3.75 years
1/4 – 7.5 years
1/3 – 10 years and so on.
The significant time cycle/squares are Square of 52 on weekly charts. Use it on important high/low as well as on those points which start a 90-day cycle. Also, two squares or a cycle of two years can be used. Inner squares (squares formed within the Square) and outer squares (squares of the same size placed adjacent or diagonal to the square) should also be seen when the price moves into the same.
A square of 90 is also important – in the same manner as the square of 52 on weekly charts and monthly charts.
A square of 12 is important.
Multiples of 9 are also important to watch.
A square of 144 is the most important square for use on monthly charts. These cycles have an influence on the price in terms of absolute numbers in addition to the time cycles they signify. It means that a movement of 144 points in stock is important by itself.
Price Time over Balance Concept
Gann laid out his rules pretty simply on page 51 of How to Make Profits in Commodities under the section headed ‘How to Determine Change in the Main Trend by Space Movements’. In that section, he outlines that:
‘When a decline in [price] exceeds the greatest decline of a previous reaction, it is an indication of a change in trend.’
He also identifies that we need to watch out for the time periods to determine when the main trend is changing. Again on page 51, he wrote:
‘When a campaign has run only 3 or 4 sections and the TIME period on a reaction exceeds the greatest time of a previous reaction consider that the main trend has changed.’ These are what Gann referred to as an overbalance in price and an overbalance in time, respectively
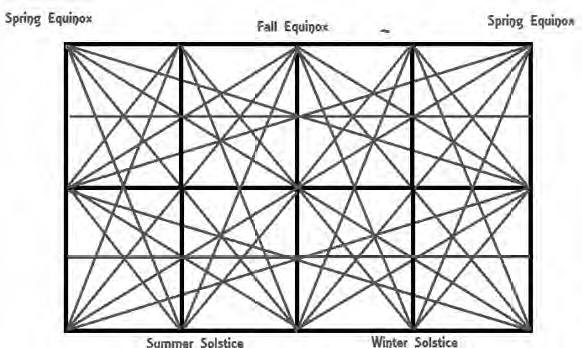
Gann Box about how is constructed and used of it by Diagram
his construct uses a starting point of March 20 which is the date when the Sun is at 0 degrees of Aries. Sun at 0 degrees Aries is also what is called the Spring Equinox. Moving 3 months forward places the Sun in the sign of Cancer. This is called the Summer Solstice. Another 3 months forward places the Sun in the sign of Libra. This is the Autumn Equinox. Another 3 months forward places the Sun in Capricorn which denotes the Winter Solstice. One more increment of 3 months and the Sun is back to 0 degrees of Aries where its journey begins a new.
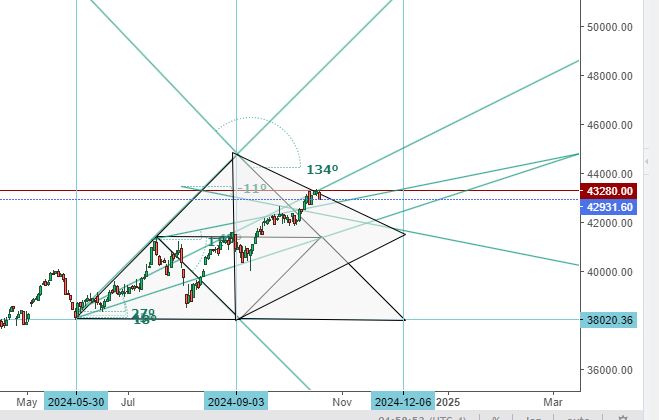
One live example of our angle chart shared for dow you may chcek one angle made resistance and dow taken exact support on same angle 2*1 its for learning purpose .may see on pur twitter profile https://x.com/Gannhidden/status/1848605592375755119
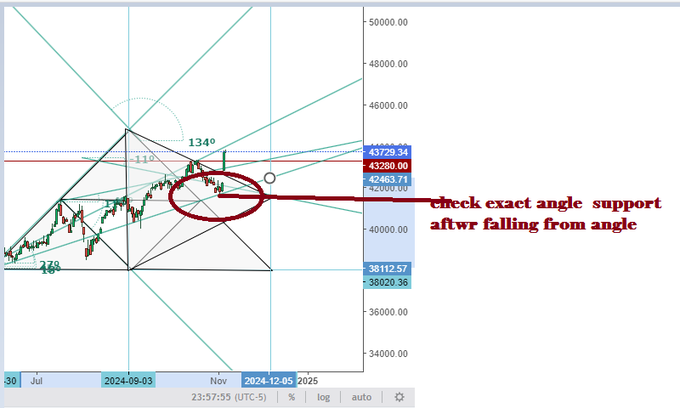
Angle support and resistance shared live chart for dow on 22-10-2024 and fresh chart after , Now may see another angle chart for and match and you wiull find magically its worked .
Price Vecor=Time Vector (A Very Fine Tool is Know in Gann Geomtery )
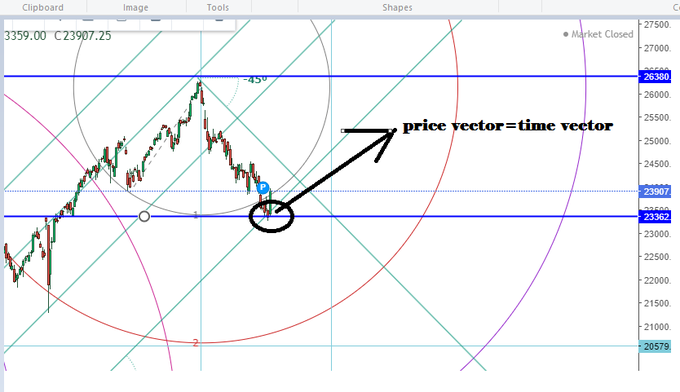
We already in one tweeet asked nifty may show up move around 19th Nov 2024 and bounce was looking clear ,may chcek price vector was completed on blue line same time we were seeing a angle from 18800 running given support .
Key Concepts
Core Gann Concepts You Will Learn
📐
Square of 9
The most famous Gann tool. A spiral of numbers arranged in a square that reveals natural support and resistance levels and time cycles.
🔲
Square of 12
A companion to the Square of 9. Used for specific cycle calculations and planetary degree conversions.
⏱
Time Cycles
Gann believed time was more important than price. Learn to calculate natural dates of market reversals in advance.
📊
Price Cycles
How price moves in predictable geometric ratios. Learn to measure moves and project future targets.
🌀
Vibration Points
Every market and every stock has a natural vibration. Identify these points and you can forecast reversals with remarkable accuracy.
📏
Gann Angles
The relationship between price and time drawn as angles on a chart. The 1x1 angle is the most powerful.
🗺
Master Charts
Gann developed special charts for the Dow Jones and individual commodities that reveal long-term cycles.
🔢
3-6-9 Concept
Tesla famously said "3, 6, 9 are the keys to the universe." Gann used these numbers as natural energy points.
🪐
Financial Astrology
Planetary cycles, zodiac signs, aspects, and retrogrades as tools for forecasting market timing.
Read & Learn
Latest Educational Posts
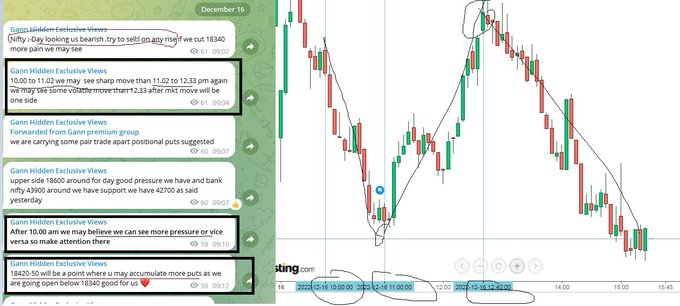
Boost your confidence in Gann theory for intra purpose
Read →📊
How Cycle’s works (Planetary One)
Read →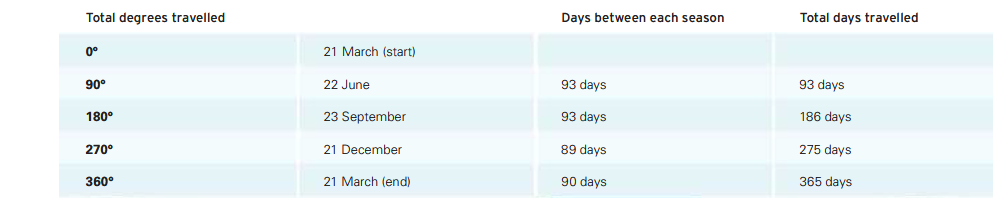
How to calculate and divide a yearly cycle of time
Read →📊
Gann Books Download Link
Read →📊
Sun Pharma (Angle Chart) For Education Purpose
Read →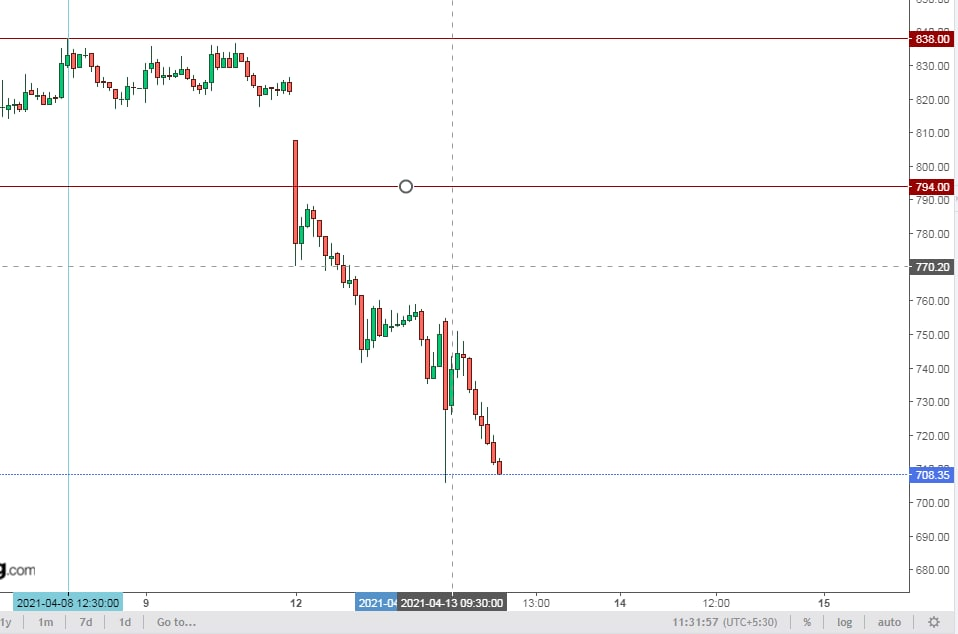
Example of Gann Woks in Market
Read →📊
Important event based on planets be understand event
Read →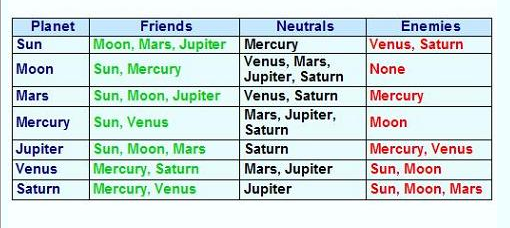
Planets Properties/Planets nature with each other
Read →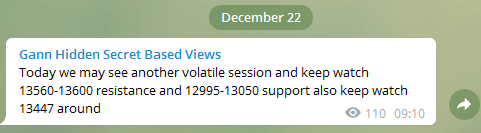
Nifty View For 22-12-2020
Read →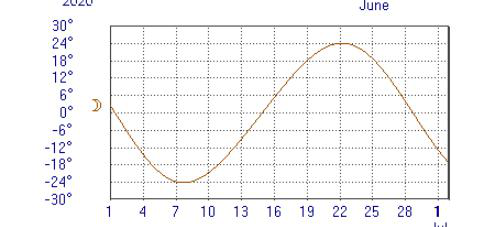
Planets About:-Topic Moon Importance
Read →📊
Education Series/Important Info
Read →Ready for Structured Learning?
Our courses take you through all these concepts systematically with live sessions, post-course support, and real-time trading examples.